By 2028, the neighbourhoods of Bospolder and Tussenwijken (BoTu) will become the first resilient neighbourhoods in Rotterdam. That is the ambition of the Resilient BoTu 2028 programme. Veldacademie is monitoring the development of community resilience in these neighbourhoods. One of the ways we do this is by mapping the networks in BoTu. We want our research not only to measure the resilience of the neighbourhoods, but also to stimulate and deepen the formation of networks.
The resilience of a neighbourhood
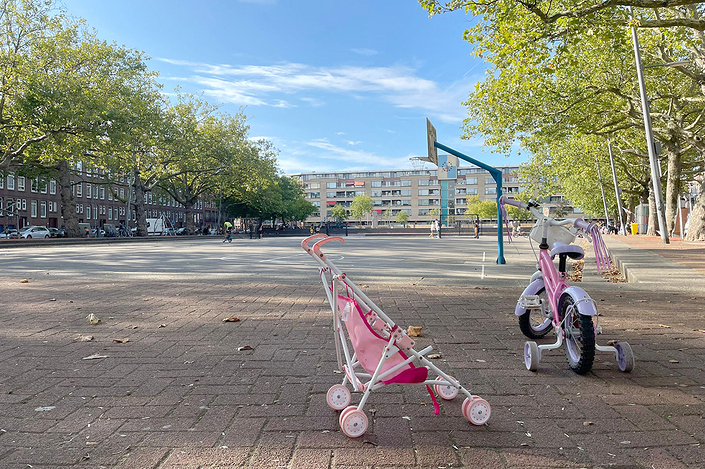
How crisis-resistant are our city districts? When unforeseen and disruptive events occur - think of the corona crisis, a flood or an energy outage - we hope that our neighbourhoods can adequately adapt to new circumstances. That is why, within the Resilient BoTu 2028 programme, residents, officials, entrepreneurs and housing corporations are working together to strengthen the resilience of the Bospolder-Tussendijken neighbourhood. To increase resilience in the district, the programme experiments with physical and social interventions.
Resilient BoTu works on community building according to the principles of Asset Based Community Development (ABCD). This means that you stimulate people to form powerful communities with each other - and that these communities, in turn, connect with other communities or (formal and informal) organisations. Networking is therefore the core of the programme.
Veldacademie supports the programme by documenting and evaluating the development of resilience in the area. How resilient is the district? Where is development taking place and where is extra attention needed? Our research is action-oriented, which means that we also try to actively contribute to the resilience of the district.
What is resilience? There is no absolute yardstick for measuring social resilience. Therefore, we look at BoTu's resilience from different angles and compare BoTu with other neighbourhoods.
- We map out the social structure of the neighbourhood: which networks and initiatives exist in the neighbourhood and how are they developing?
- We measure the social development of residents (looking at factors such as feelings of safety, well-being, skills, etc.).
- A third important part of the research is governance, and that is about the question: who makes the move in the neighbourhood? Is it the government, or can residents take decisions themselves?
Ultimately, we not only want to know how residents are doing, but also whether they are organised and can take action together - and how the Resilient Botu 2028 programme contributes to this.

Social structure
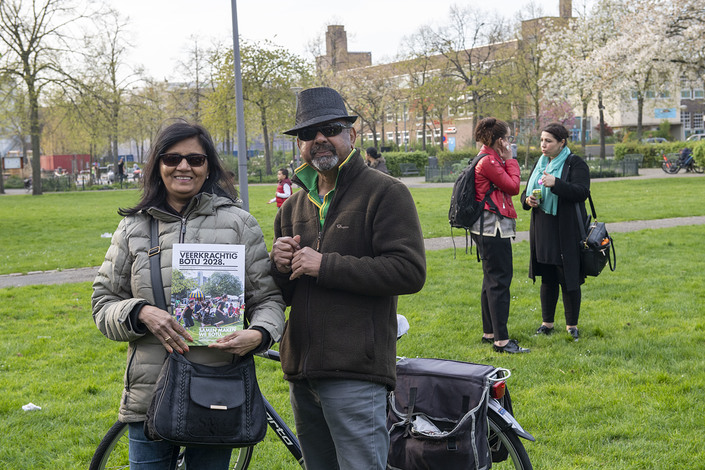
We take stock of the district's social networks by mapping initiatives and documenting stories. From there we explore which networks are active in the neighbourhood and which parties work together on the local task. We collaborate with the Stichting Wijkcollectie (Neighbourhood Collection Foundation) and organise story walks and story cafes in the neighbourhood. With these cafés and walks we stimulate networking in the neighbourhood. They are also good opportunities to collect data on who is active in the neighbourhood and in what way. We map partnerships of local initiatives using social network analysis.
Results: the social network analysis shows that the neighborhood network in BoTu has grown. Both the number of actors and the number of connections increased between 2019 and 2022. In addition, the closeness of the network also experienced a positive trend. The two most distant network points are closer together in 2022 than in 2019. Thereby, the average distance between two network points also decreases slightly. With these developments, the informal neighborhood network is increasingly taking a central role in relation to formal parties.
Social development (Social Index+)
Social development is measured with the Index+, an extension of the Social Index. This is the quantitative part of the monitor and provides insight into how the neighbourhood and its residents are developing compared to the Rotterdam average and three selected focus neighbourhoods in Rotterdam-South: Hillesluis, Afrikaanderwijk and Feijenoord.
Results: the total score on the Social Index has decreased slightly for BoTu over the past four years (2018 – 2022), as has the average score for all of Rotterdam. As a result, the distance to the Rotterdam average has increased and the positive margin compared to the comparison neighborhoods Afrikaanderwijk, Feijenoord and Hillesluis has also disappeared. The slight decrease in the total score on the Social Index appears to be mainly due to a solid decrease on subjective indicators. Indeed, the objective score shows improvement, while the subjective perception shows deterioration. The objective improvements are particularly visible in Bospolder, and have remained more or less the same in Tussendijken. In contrast, the subjective score for both neighborhoods has dropped to the lowest point since the 2014 baseline measurement. The increasing divergence between the objective and subjective scores on the Social Index is a development that can be seen throughout Rotterdam.
Governance
Finally, we document how the governance structure in BoTu is being shaped by the Resilient BoTu 2028 programme. Who decides how the programme is implemented? Are there responsive government agencies and institutions as intended? Are the implementing organisations linked to the networks of local initiatives?
Results: the organizational structure and partnerships within the Resilient BoTu 2028 program have changed over the period (2019 - 2023). The engaged community of individuals and groups around the program increased in size and diversity. The community built on collaborations in the neighborhood prior to the program. During the program, new key individuals, groups and initiatives became increasingly involved. The developing community of Resilient BoTu 2028 consists of both formal and informal actors. At the start of the program, these included the Municipality of Rotterdam, housing corporation Havensteder and residents' initiative Delfshaven Coöperatie. During the program, more residents, local initiators, entrepreneurs, general practitioners and school boards joined. Because of the changed roles, the force field has also shifted. Where influence and control initially lay with formal institutions, such as the municipality of Rotterdam and Havensteder, over time this has increasingly been placed with the neighborhood. This development was the result of the awareness of a growing "community power" in the neighborhood, which became visible during the corona crisis, among other things. In addition, there was an increasing emphasis on Community Building through training in Assett Based Community Development (ABCD). This resulted, among other things, in the elimination of the formal core team, the appointment of project leaders from the neighborhood and the placement of the program manager's mandate with a residents' council that decides on budget for local initiatives that come forward through an open call.
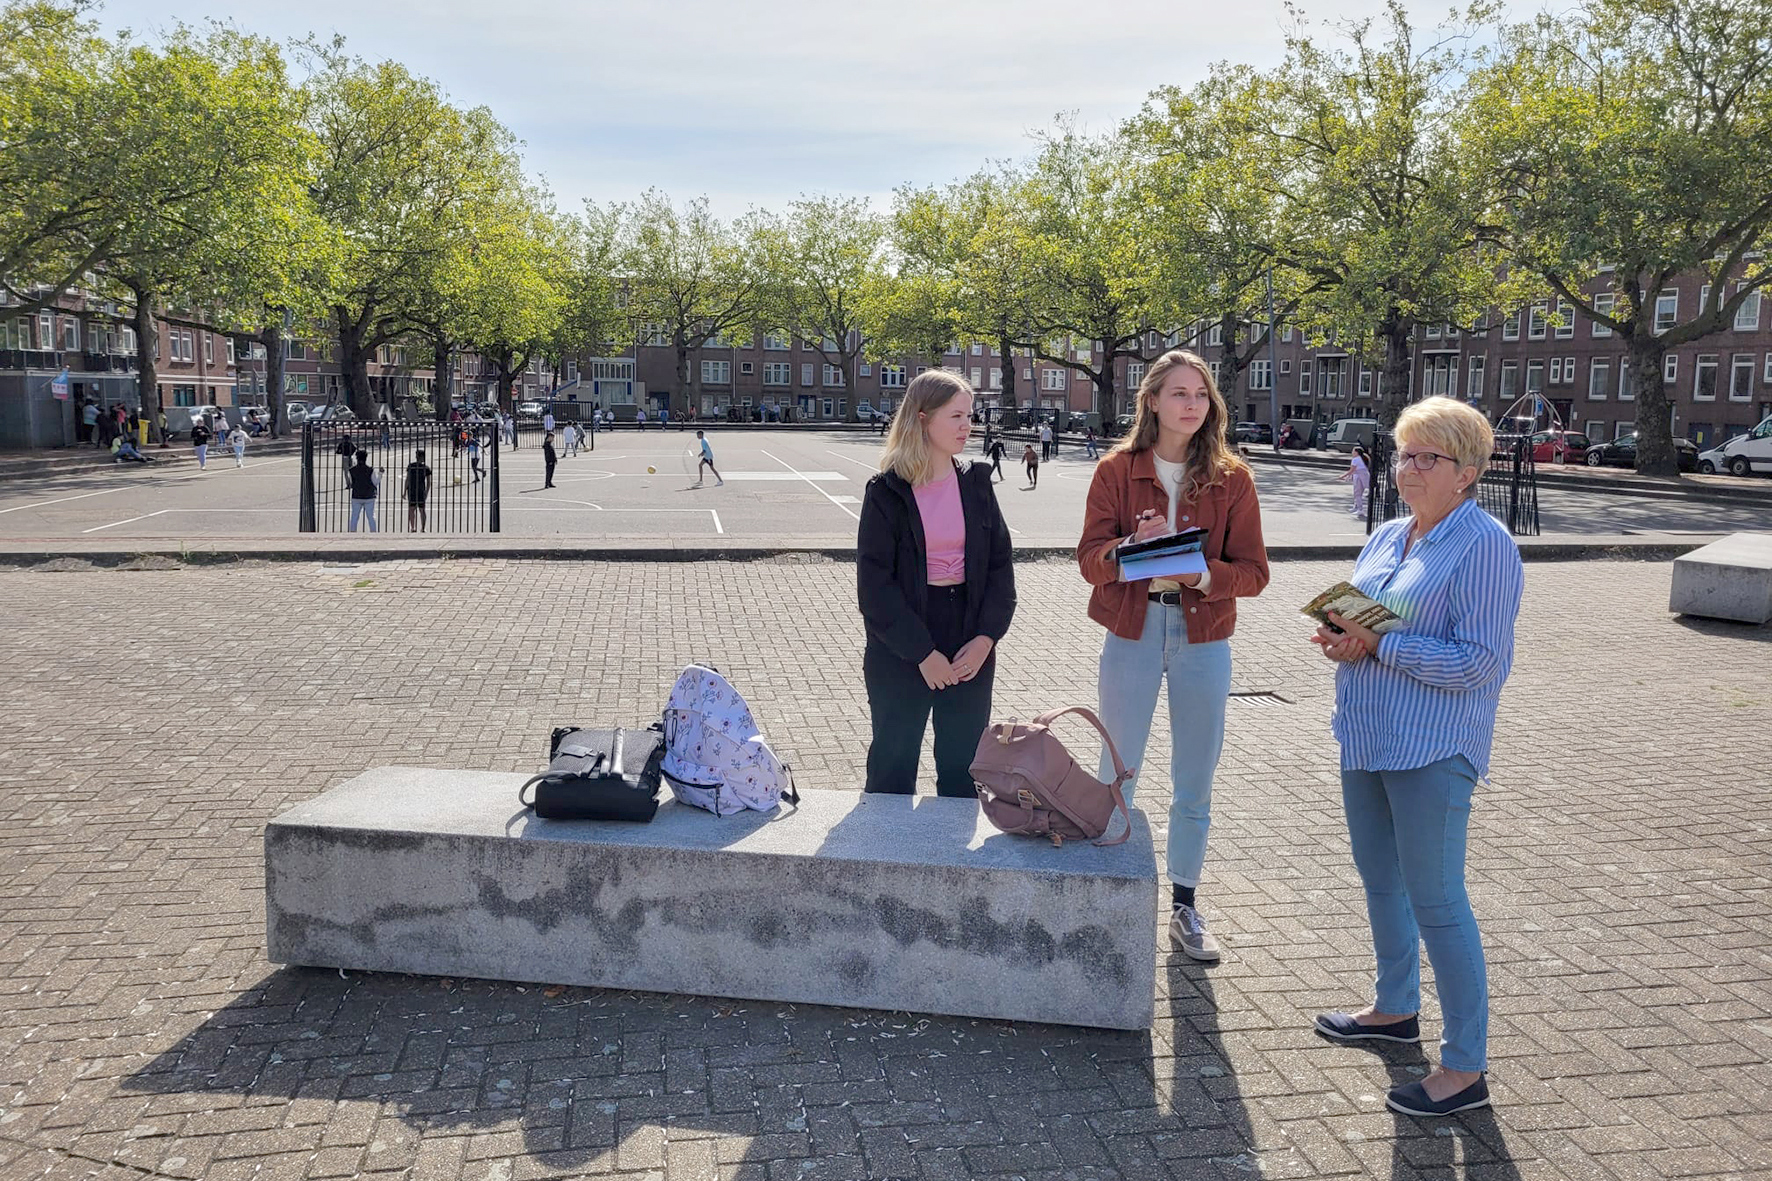
Students map out networks and initiatives
The data collection for the monitor is done in collaboration with our educational partners. Over the past three years, students of the Rotterdam University of Applied Sciences have made an inventory of all the initiatives and networks in the neighbourhood. In this way, we are mapping out which of these contribute to developments in the neighbourhood. Other students are researching the working and evolution of resilience of citizens' initiatives or how resilient governance in BoTu.
The monitor in a new look
Since 2022, we have presented the monitor on a website. On the website, all research results can be reviewed by anyone. A map has been created on which the networks and initiatives are marked. The website is primarily intended as an accountability tool for management, but it also has a secondary purpose: those involved in the neighbourhood can find out what other initiatives there are, which may further stimulate networking.
Read more about the Resilient BoTu2028 programme and the results of our research at: https://www.veldacademie.nl/veerkracht-monitor-botu
Knowledge exchange in a learning environment
The monitor is completed in March 2024. The report and a handout can be downloaded. (Only in Dutch.) In the coming months we will organize several meetings to share generic lessons about neighborhood development and support a learning process focusing on the significance of these lessons for (1) policy and governance, facilitating collaboration between informal and formal networks (2) place and space, physical opportunities for social development (3) organizing a monitor in a learning environment.
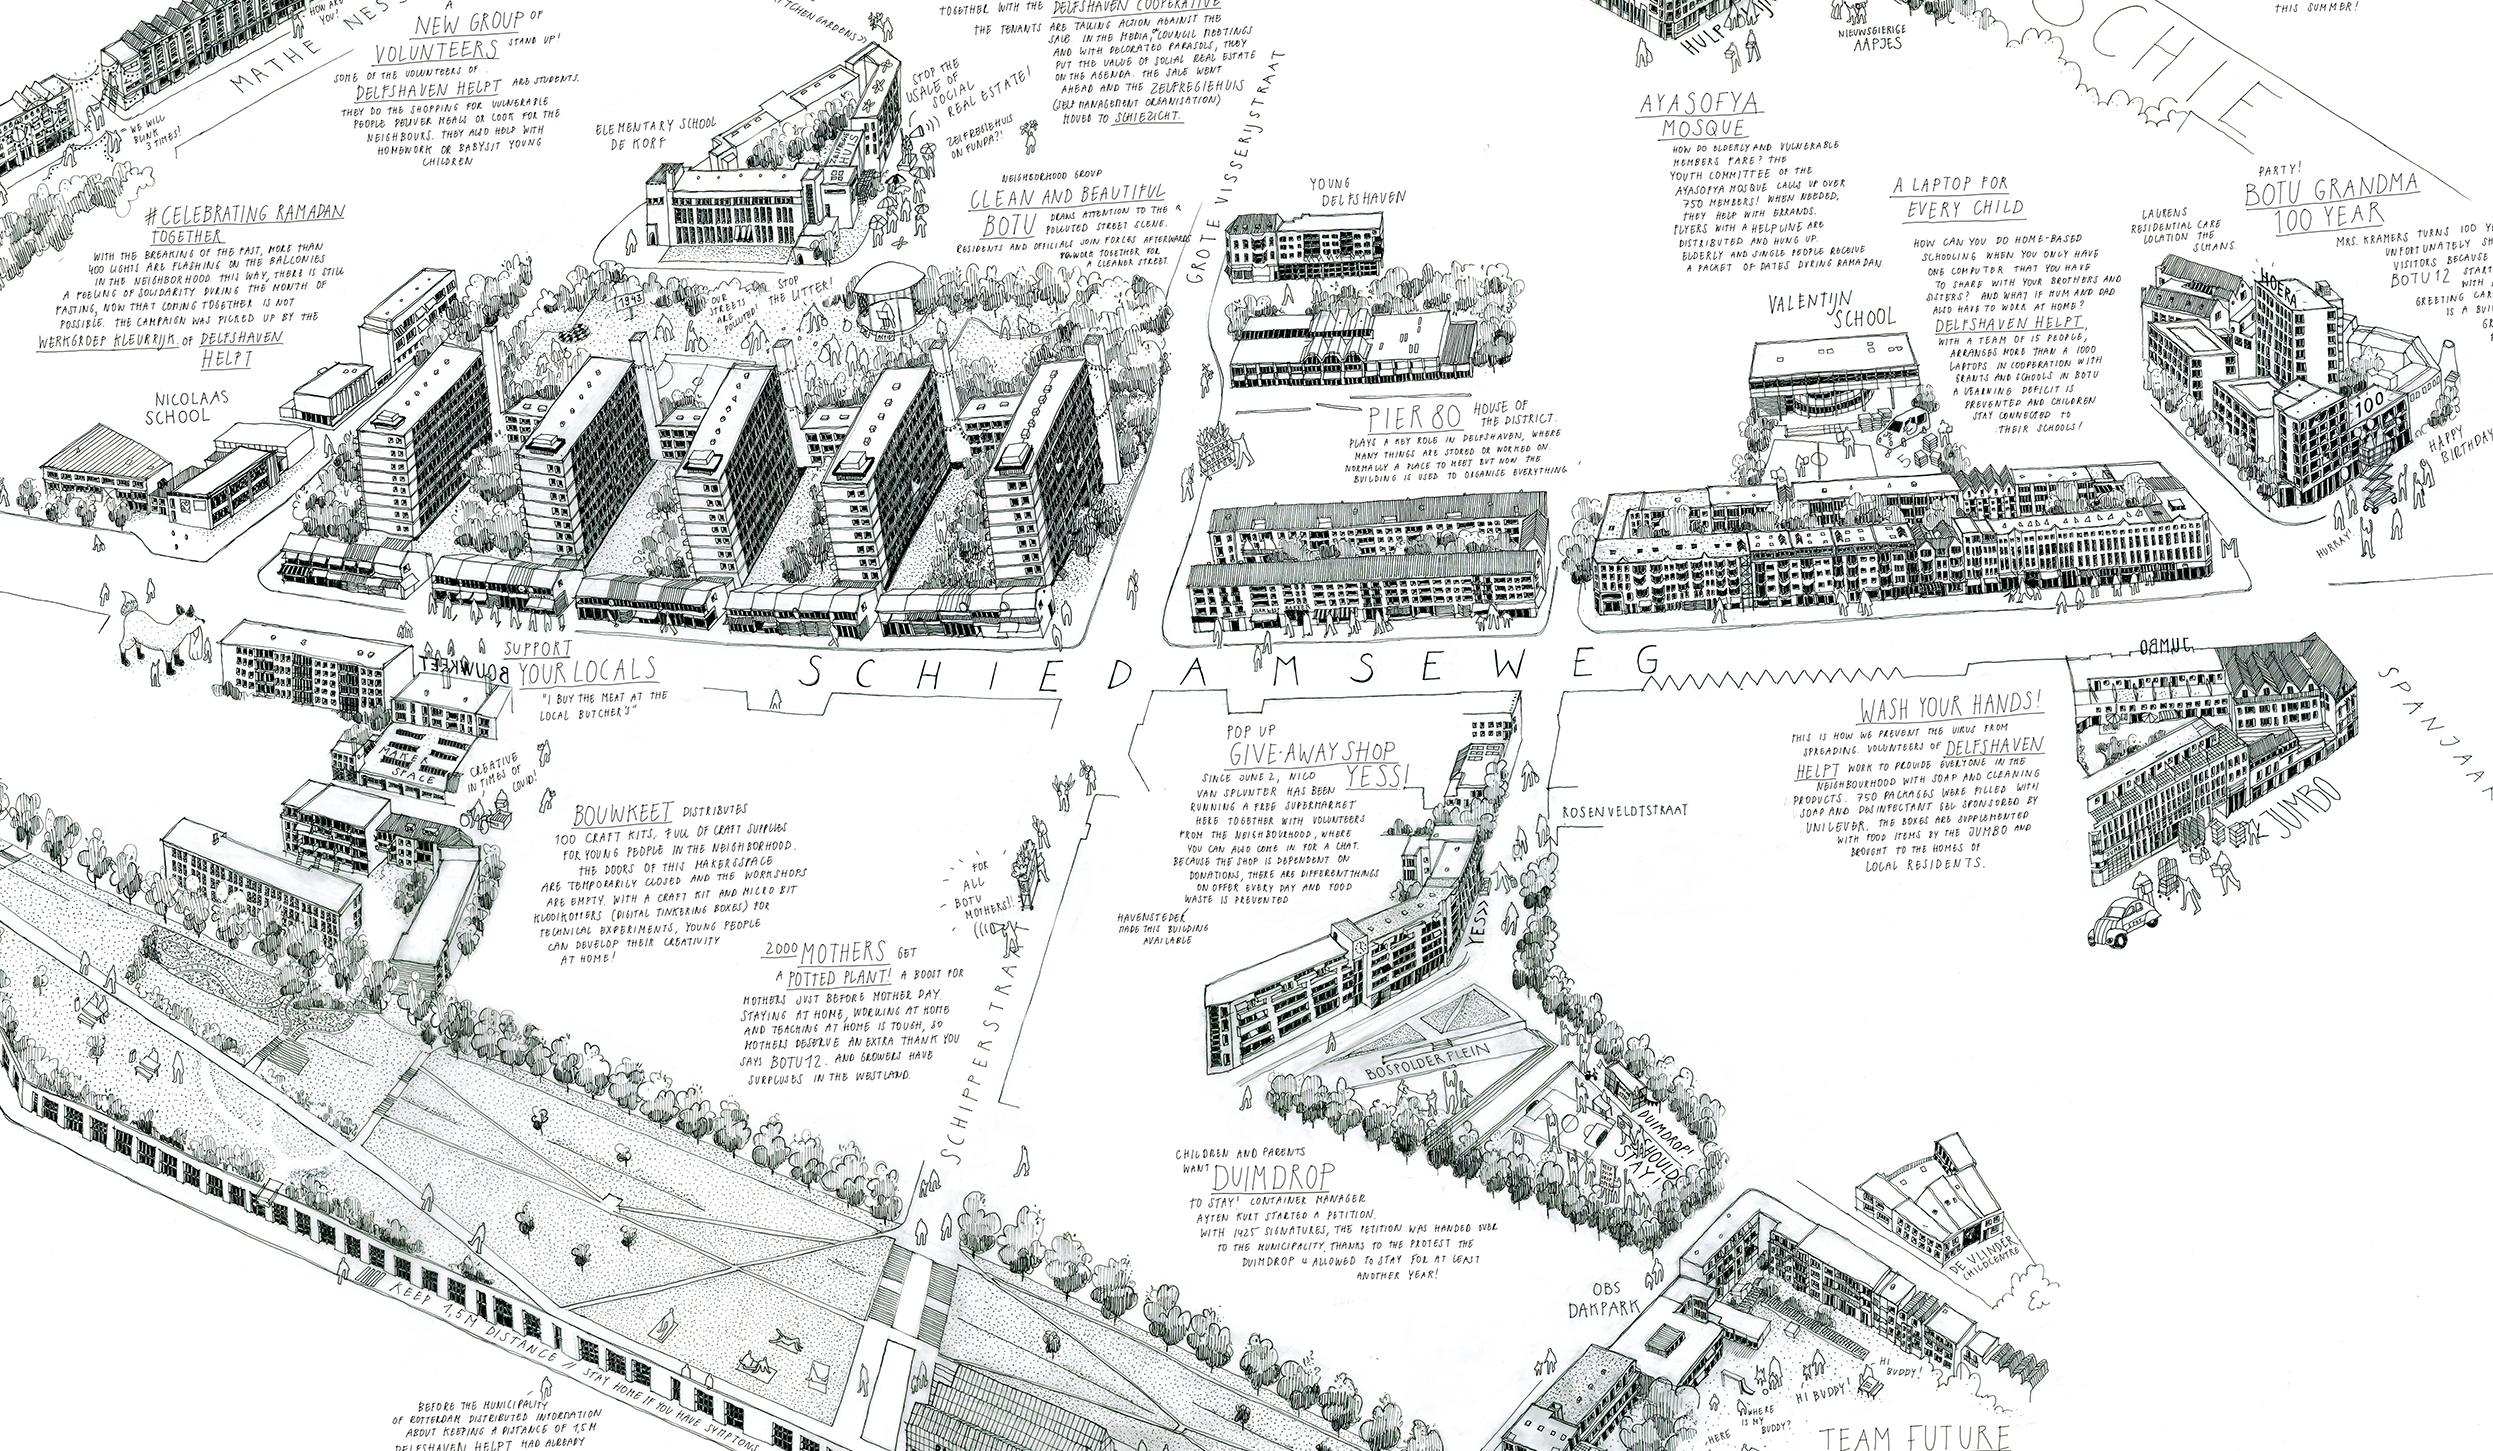
Graphic: Corona Chronicles, Studio NadiaNena